
An old out of date image of the Internet
To go with the image above here is some data: The image above is of a partial map of the Internet based on the January 15, 2005 data found on opte.org. Each line is drawn between two nodes, representing two IP addresses. The length of the lines are indicative of the delay between those two nodes. This graph represents less than 30% of the Class C networks reachable by the data collection program in early 2005. Lines are color-coded according to their corresponding RFC 1918 allocation as follows: Dark blue: net, ca, us Green: com, org Red: mil, gov, edu Yellow: jp, cn, tw, au, de Magenta: uk, it, pl, fr Gold: br, kr, nl White: unknown.
Notice how quickly we find ourselves having to research around the information just to get a basic handle on what is going on. For instance if I want to find out what is the RFC 1918 allocation? This is the answer:
Request for Comment 1918 (RFC 1918), “Address Allocation for Private Internets,” is the Internet Engineering Task Force (IETF) memorandum on methods of assigning of private IP addresses on TCP/IP networks. Along with NAT (network address tunneling), RFC 1918 facilitates expansion of the usable number of IP addresses available under IPV4, as a stopgap solution to prevent the exhaustion of public IPs available before the adoption of IPV6. It’s not necessary to register private IPs with a Regional Internet Registry (RIR), which simplifies setting up private networks. RFC 1918 was used to create the standards by which networking equipment assigns IP addresses in a private network. A private network can use a single public IP address. The RFC reserves the following ranges of IP addresses that cannot be routed on the Internet:
- 10.0.0.0 - 10.255.255.255 (10/8 prefix)
- 172.16.0.0 - 172.31.255.255 (172.16/12 prefix)
- 192.168.0.0 - 192.168.255.255 (192.168/16 prefix)
Computers on the inside of the network can communicate with the Internet through NAT. NAT translates an IP address used within one network to a different IP address known within another network. Typically, a company maps its local inside network addresses to one or more global outside IP addresses and unmaps the global IP addresses on incoming packets back into local IP addresses.
From: https://whatis.techtarget.com/definition/RFC-1918
Each element of the explanation has another area of information attached or linked to it, so that if I wanted to I could mine more and more information and have more and more data available to me. But in doing this do I actually 'know' anything more?
The image that accompanies the text is a now archaic map of only part of what was then the Internet. But it was already so complex that it began to resemble the way both a brain is interconnected and the way that a fungal network can connect a forest into its soil system.
How a fungal network works.
How interesting that these forms are often similar to an animal's central nervous system. The body is again a reference point and we are reminded that whether we are looking at how brain synapses communicate or how the Internet develops complexity, there will be an underlying mathematical beauty.
The way that data quickly makes things appear as if they are lost in a network of connections was something Mark Lombardi found fascinating and he was excited by the challenge of how to reveal what lay behind the complexity.

Mark Lombardi, Bill Clinton, The Lippo Group, and Jackson Stephens of Little Rock, Arkansas (5th Version), 1999 (found at artcritical.com)

Click on image to enlarge
Lombardi's diagrams rarely if ever include non human actants. They reflect the fact that as Timothy Morton puts it, "Quite a long time ago humans severed their social, philosophical and psychic ties with non-humans." (Being Ecological, p.67)

Above and below ground
Similar to the diagram immediately above, Lombardi's work reveals what we suspect must be there but that we don't really 'see'. We are ourselves interconnected in very complex ways, but our place within everything else is exponentially more complexly interconnected.
Much of Lombardi’s practice was research-based, with the information he sourced written down on index cards. There is an overlap therefore between work of this sort and artwork that is focused on documentation. The frayed edges between different disciplines and approaches to art making perhaps being where the real 'friction' and 'heat' is being generated by contemporary artists.
As an artist that uses narrative I also like the fact that Lombardi’s drawings are “narrative structures” each network drawn conveying a story. The gallerist Deven Golden had this to say about how Lombardi got started:

Lombardi developed his work in a time before computer generated imagery became the norm. We now have a heightened awareness of how data is mined and shaped in order to manipulate us. I have suggested a few times above that the complexity that really exists lies far beyond how humans interact with each other but how to demonstrate this in the form of made objects is much harder. I will therefore end this post with looking at one example of building complexity from a very simple starting point and ask you to think about the implications of using this type of approach to visualising your own research.[He was] talking to a friend of his, a lawyer, in California. Mark was telling him about a couple of banks that had closed in Texas, and the lawyer said, “Yeah, and because of that, these Savings and Loans closed in California.” And his friend proceeded to tell him how a series of byzantine corporate connections tied the various financial institutions together. It was very convoluted, and so Mark made some notes—he obviously was predisposed to thinking about this sort of thing. As Mark told it to me, it was kind of like how some artists . . . do the New York Times crossword puzzle in their studios to help them clear their minds. Anyway, every couple of days, after going over his notes and diagrams, he would call his friend back and ask him more questions, which would lead him to make more diagrams. Then, one day, after what I understood to be a couple of months of working on these diagrams to “relax,” Mark had this “aha!” moment . . . The diagrams were more visually interesting than his paintings. And, perhaps just as importantly, they pulled together everything Mark was interested in—drawing, social/commercial interactions and their hierarchies, and politics—into a single pursuit.I really liked this quote, because it reaffirmed for myself how many things begin simply by having a chance conversation with someone. The difference of course is that Lombardi was both prepared to put time into making the initial diagrams and had enough experience to recognise that what he was doing was more interesting than the paintings he was making.

Click on image to enlarge

Michael Hansmeyer
Architect and programmer Michael Hansmeyer has made beautiful complex columns that can be laser cut from stacked cardboard sheets. Although this project is now several years old, (it was from back in 2011), the implications of making forms based on growing complexity in a similar way are still relevant. His project was centred on the conception and visualisation of a new architectural column order based on subdivision processes. What interested me was first of all his choice of a column. The column is central to the architectural imagination and identifying types of columns were one of the ways that you could identify the ages of buildings.

Classical column types
However the first columns would have been trees cut down to make buildings and their memory is still engrained in the forms taken by the stone carvings. This interrelationship between biology and architecture being at one time something that would have been vital and now I believe being something that we need to revisit if we are to remind ourselves how interconnected we are with everything.

The backbone column
Our backbone allows us to stand and takes huge strains in doing so. It has evolved over millions of years and in its own internal structure reveals how complexity can evolve out of simple divisions.

Internal structure of bone
Hansmeyer's work creates images that both work as columns and work as triggers for our imaginations, reminding us of how we are like columns too, as well as showing how complexity can be arrived at simply by creating subdivisions.
An abstracted doric column was used as the input form (data) to the subdivision processes. Data about the proportions of the the column’s shaft, capital, base fluting and entasis was entered into a computer program. The input forms were tagged to allow the subdivision process to distinguish between individual components. This allowed a diversity to be developed but certain factors such as overall proportions and sizes were kept to ensure an overall coherency and continuity. The ornament developed by controlled subdivision is in a continuous flow, yet it consists of very distinct local formations. The complexity of each column contrasting with the simplicity of the subdivision generative process.

Cutting the layers from cardboard sheets
Each subdivision takes place within a two-dimensional plane which gives a constantly changing drawn cross-section of the evolving column and like a 3D print, as each section is made it can be added to the next in order to create a column.

2D sections of an evolving column
Once the process begins it reveals the organic nature of branching complexity based on sub-dividing column dimensions, something that we can intuitively understand as being akin to how natural evolution might work.

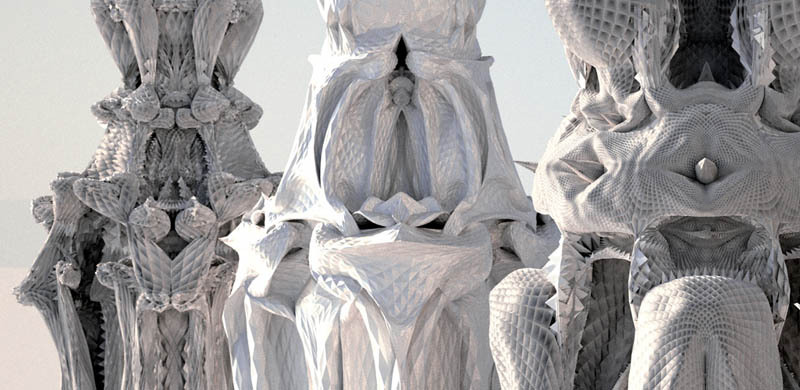
Computer visualisations of column possibilities
Finally we have a series of structures not unlike the imaginative organic structures envisioned by Gaudi.

Gaudi: Sagrada Familia

Stuttgart airport
The principle of subdivision and the idea of the tree as a column and support structure is seen here again in the biomimicry of the internal construction of Stuttgart airport.
I'm ending up in a territory between design and fine art and once more I would like to make an appeal for the removal of sharp divisions between disciplines, divisions that I feel strongly are artificial and lead to confusion and the compartmentalisation of experience. If we are to ever repair the severed social, philosophical and psychic ties with non-humans, perhaps we ought to begin with repairing the severed connections between art and design and begin the process of healing the old art and science divide.
References:Barad, K (2007) Meeting the universe half-way New York: Duke Press
Morton, T (2018) Being Ecological London: Pelican
Morton, T (2013) Hyperobjects London: University of Minnesota Press
Patricia Goldstone's book Interlock: Art, Conspiracy, and the Shadow Worlds of Mark Lombardi is well worth reading and gives an excellent overview of the implications for work of this sort.
The rise of the data artist
Data and translation: I have posted on the idea of translation before as well as how musical notation can be visualised. Nathalie Miebach translates weather data into complex sculptures and musical scores and is an interesting artist to explore if you want to look at how information can be a joyful and life affirmative thing.
Information is Beautiful a website devoted to how data can be visualised.
Michael Hansmeyer talk
See also:


